
Business
How Online Shoppers Navigate Labels

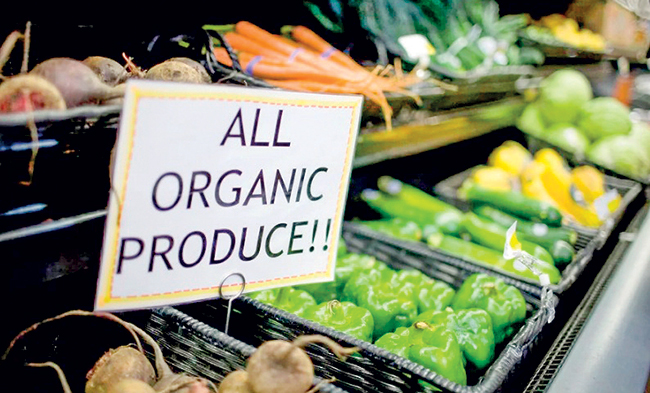
Online food retail has changed how trust is built. When customers browse your digital shelves, they are no longer holding a package, reading fine print or inspecting seals in person. Instead, their decisions hinge on small on-screen signals, badges like “Organic,” “Non-GMO,” “Fair Trade.” These labels now act as silent salespeople, influencing whether a product is added to the cart or quietly skipped.
For a growing segment of online shoppers, particularly younger, digitally fluent consumers, these badges are not decorative. They are decision shortcuts. But they are also increasingly questioned. Is the claim credible? Is it verified? Is it meaningful or simply marketing language? When shoppers cannot physically examine packaging, uncertainty creeps in and skepticism grows.
Recent findings from a comprehensive survey conducted by the TilliT team reveal a critical tension for online food retailers. TilliT is a digital platform that has been using AI and Blockchain for end-to-end tracking of global supply chains and the survey covered over 1,000 consumers representing diverse demographics and included both an online questionnaire and in-person meetings to ensure depth and representation.
The results show that while digital grocery delivers speed and convenience, it also introduces a trust gap. Today’s shoppers are informed, value-driven and actively seeking alignment with health, ethical and dietary priorities. Yet too often, the digital shelf fails to communicate credibility clearly. This is no longer just a branding challenge; it is a trust problem. And in e-commerce, trust is what turns product views into purchases.
The digital grocery cart is being pushed most frequently by younger adults. Our survey data shows a clear concentration of shoppers in the 18-34 age range, with significant activity among those aged 18-24 and 25-34.
Their shopping frequency varies, some are weekly devotees to delivery apps, while others shop online for food a few times a month or only occasionally. When it comes to their spending philosophy, the majority are pragmatic balancers, seeking a sweet spot between price and quality. However, a meaningful and growing segment, often driven by health, ethical or dietary needs, is explicitly willing to pay more for higher quality or for products bearing labels they trust. This signals a market where value is increasingly defined by transparency and credibility, not just the lowest price.
Here’s a curious finding: some online shoppers admit they usually don’t even notice certification badges while browsing. The digital interface, with its rapid scrolling and visual noise, can make these small icons easy to miss. But for those who do look, these badges become powerful signals. The most frequently noticed and sought-after labels include Organic, Sugar-free/Low sugar, Gluten-free, Vegan/Vegetarian and Non-GMO, followed by Halal and Fair Trade. Crucially, when a shopper’s eye does land on a relevant badge, its importance skyrockets.
Most rate these certifications as ‘very’ or ‘somewhat’ important in their final purchase decision. An Organic badge isn’t just decoration for a health-conscious millennial; it’s a key filter in their search for authenticity.
Don’t mistake notice for naivety. Online shoppers approach these badges with a healthy dose of caution. When asked about their level if trust, responses paint a picture of a skeptical yet hopeful audience. The most common sentiments are ‘I mostly trust it’ and the telling ‘I am not sure.’ Far fewer express full, unwavering trust. This ‘trust gap’ is the central challenge for brands and retailers. Shoppers want to believe the claims, but the digital environment, where anyone can slap a ‘natural’ icon on a product image, breeds uncertainty. This is especially true for claims related to sustainability or ethical sourcing, where verification feels more abstract than checking for gluten.
This is where the solution becomes crystal clear. Shoppers are practically begging for proof. A strong majority find a ‘Verified by an independent system’ mark, accompanied by a clickable link to view the actual certificate, to be ‘very’ or ‘extremely’ valuable. This isn’t a nice-to-have; it’s a powerful trust-builder. The data is striking: when presented with detailed certificate information (who issued it, its validity dates, what it actually means), most respondents said it would make them ‘much more likely’ to buy the product.
In a world of vague claims, verifiable, third-party validation is the antidote to doubt. It transforms a badge from a marketing symbol into a credible credential.
So, what should that click reveal? Shoppers have spoken and their priorities are pragmatic. Above all, they want a simple explanation in everyday language. Jargon and technical terms create barriers. Following that, they want to know the issuing organization’s name, is it a reputable certifier? Validity dates are critical; is this certification current? Shoppers also want clarity on scope: which specific products or ingredients does this certificate cover? Knowing the country of issuance is also a common request, adding another layer of context. This checklist is a blueprint for digital transparency: keep it simple, show the source, prove it’s current and define the scope.
Given this hunger for verification, the business implication is straightforward. When presented with a choice between two online shops selling the same product, one that clearly verifies and explains its certification badges and one that does not, respondents showed a very strong preference for the verified shop. They are ‘very likely’ or ‘somewhat likely’ to choose the platform that offers transparency. This isn’t a minor tilt in preference; it’s a significant competitive advantage. In the battle for the digital grocery basket, the retailer that invests in making labels trustworthy isn’t just building consumer confidence; it’s driving conversion and loyalty.
While the demand for verification is high, baseline understanding of common labels varies. Shoppers tend to be very familiar with terms like Organic, Vegan and Gluten-free, labels often tied to immediate personal health or dietary choices. However, familiarity drops noticeably for other important certifications like Non-GMO, Fair Trade or specific allergen-free claims. This ‘familiarity gap’ presents an opportunity. It’s not enough to just verify a Fair-Trade badge; brands and retailers can also play an educational role by explaining, in that simple language shoppers crave, what that certification means for workers and communities. Transparency paired with education is a powerful combination.
The journey from a digital storefront to a delivered grocery bag is paved with questions. The findings are a clear signal to the food and retail industry: the era of passive, decorative badges is over. Today’s online shopper, particularly the younger, value-driven consumer, is a detective. They are looking for clues, verifying sources and making informed choices aligned with complex personal values. The brands and platforms that will thrive are those that recognize this shift. They will move beyond simply displaying labels to actively validating them, explaining them in human terms and building a bridge of trust that turns cautious scrolling into confident clicking.
In the end, the most important ingredient in the future of online food shopping won’t be listed on the label, it will be the transparency that proves the label is true.
by a special correspondent



The National Business Facilitation Centre (NBFC), which is being established under the Presidential Secretariat with the aim of removing administrative and regulatory barriers that exist among government institutions in relation to investment and industry and expediting these processes, will be opened tomorrow (22).
The centre is being established on the President’s initiative with the aim of bringing about a positive transformation in the industrial sector. The centre will provide solutions to issues that arise in dealing with the government machinery when starting and operating a business, while also coordinating with the relevant government institutions to provide the necessary facilities.
The “ViYASA” National Business Facilitation Centre (NBFC) has been established at Building C-80, Hector Kobbekaduwa Mawatha, Colombo 07, and is headed by Senior Additional( Secretary to the President, Seevali Arukgoda.
The centre will be opened under the patronage of Minister of Labour and Deputy Minister of Finance and Planning Dr Anil Jayantha Fernando and Minister of Industry and Entrepreneurship Development Sunil Handunnetti, with the participation of Secretary to the President Dr Nandika Sanath Kumanayake.
The website https://nbfc.presidentsoffice.gov.lk is also scheduled to be officially launched on the occasion.
President’s Media Division)
By Sanath Nanayakkare
Artificial intelligence and automation present serious challenges for workers – such as job consequences seen in docks and rail systems – and emphasises that workers cannot simply stop technological progress. By gathering young trade unionists in Sri Lanka, the ITF aims to establish key principles for engaging with technology, ensuring workers have a strong voice at the bargaining table, and encouraging constructive social dialogue with corporations and governments.
These compelling words from ITF General Secretary Stephen Cotton underscored the urgent reality facing modern labor as rapid technological advancements sweep across global industries.
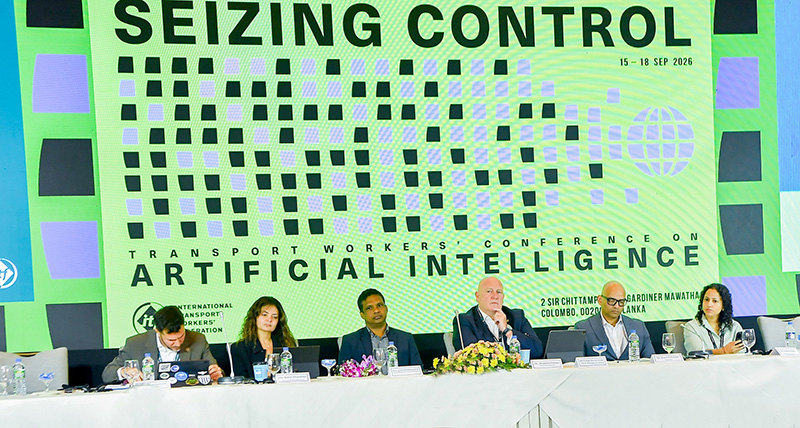
Confronting this shifting landscape head-on, the International Transport Workers’ Federation (ITF), in partnership with the National Union of Seafarers of Sri Lanka (NUSS), convened a ground-breaking conference on artificial intelligence in Colombo from September 15–17.
As the ITF’s first-ever AI-focused global conference and the first of its kind hosted in Sri Lanka, the landmark event marked a critical milestone in balancing technological innovation with worker-centered safeguards.
Representing over 16.6 million transport workers worldwide, the ITF designed the gathering to tackle the multifaceted impacts of AI on safety, operations, workforce development, and governance. Rather than resisting progress, the conference focused on proactive engagement, establishing guiding principles to protect workers’ rights and privacy both at sea and on land.
Key discussions centred on sharing best practices for upskilling and reskilling transport personnel, ensuring that human oversight remains central to AI-driven logistics, routing, and maintenance.
Reflecting on the historic nature of the event, Boa Athu, CEO of National Union of Seafarers Asia Pacific, noted that the conference represented a monumental moment as AI emerges as a permanent fixture of contemporary life.
Highlighting NUSS’s pride in hosting the event in Colombo, Athu emphasised that AI offers transformative potential when guided by strong social dialogue, equitable access to training, and robust governance safeguards.
Ultimately, the Colombo conference demonstrated that the future of transport must be shaped by those who keep the world moving. By uniting international labour leaders, affiliates, port operators, and regulators, the event laid a vital foundation for inclusive policy frameworks that champion fair labour standards, securing a powerful voice for workers in an automated tomorrow.

By Sanath Nanayakkare
As Sri Lanka experiences a surge in visitors from its largest tourist market, India, a modern administrative hurdle has emerged at Bandaranaike International Airport (BIA).
While nations like India and Pakistan have successfully transitioned to fully digital driving licences and cashless ecosystems, Sri Lanka’s Department of Motor Traffic counter still requires a physical card to issue temporary local permits, The Island Financial Review learns.
This mismatch creates significant friction for independent travelers who rely entirely on smartphones and cloud-stored credentials. Tourists turned away at the airport – and sometimes redirected to the Werahera office in vain – find themselves unable to legally rent and drive vehicles. Consequently, this policy gap harms local car rental operators, causes tourist frustration, and deprives the government of valuable permit revenue.
The situation highlights a distinct irony: Sri Lankan motorists easily travel abroad using International Driving Permits that are readily accepted in India and Pakistan, yet local infrastructure cannot reciprocate due to outdated verification systems.
Recognizing the problem, Department of Motor Traffic officials have noted that upgrades and new equipment are currently in the works to integrate foreign digital platforms.
For a nation aggressively pursuing a national digitalisation drive, rapidly modernising these transport protocols is essential to keeping pace with global travelers and unlocking the full potential of its tourism economy.

“ViYASA” National Business Facilitation Centre (NBFC) to be opened tomorrow (22)

Court of Appeal Judge M. Sri Mevan Anthony Edirimannasuriya Corea appointed as Acting President of the Court of Appeal

President instructs expediting further measures concerning Sivarasa Anojan, sentenced to death in Saudi Arabia

It’s Shafali vs Athapaththu as Sri Lanka seek to stop India juggernaut

Trophy row unlikely to repeat in Japan

Powerful explosions at Syrian army site near Aleppo injure at least four

‘Dates have the highest sugar content to fight Coronavirus’

Sunday Island 27 December – Headlines

#SundayIsland 17th December – Headlines

Sunday Island – 28th March

Sunday Island Headlines – 21 March

Sunday Island – 21st February – Headlines
-
 News5 days ago
US embassy won’t comment on IGP’s probe into joint drug raid
-

 News4 days ago
Bid for Basil’s extradition nears final stage: Police
-

 News3 days ago
Shanakiyan urges urgent action over reported death sentence for Lankan in Saudi Arabia
-

 Features7 days ago
The emptying university: why are academics leaving?
-

 Business5 days ago
All-new Bolero MaXX unveiled in Sri Lanka
-

 Opinion7 days ago
Who committed genocide and created mass graves in Sri Lanka?
-

 News2 days ago
Namal Rajapaksa Buddhist gambit fails, bail denied
-

 Opinion5 days ago
A journalist who wrote across the divide